-
Portfolio
-
Hi there! I'm Yiwen. Welcome to my UX portfolio page where I demostrated my work on quantitative and qualitative UX research projects.

Google Protection Sentiment Tracker
My Role: UX Researcher (Google 2024 Intern Project)
Timeline: 9 weeks
This project aimed to develop a survey tracker for global and country-level privacy sentiment trends and competitive benchmarking for Chrome and Android, I analyzed survey tracking data from 30 waves across 18 countries, and initiated and maintained cross-team collaborations, streamlining data integration and ensuring long-term data access for the survey tracker. The insights were delivered to leadership and 40+ cross-functional partners. Findings remained influential and were presented at cross-team summits after my internship.
Solutions: Large-scale Data Analysis| User Segments Analysis | Competitor Comparison
View Details
WhatsApp Feature Awareness Research
My Role: UX Researcher (Meta 2022 Intern Project)
Timeline: 12 weeks
This project aimed to answer questions such as "which features have low awareness compared to other features within a team or across teams, and how should we prioritize them for improvement?" I used survey methodology to collect data over 6000 users across 5 countries on 60 WhatsApp features and quantitative analysis to provide research insights for feature prioritization based on users' awareness. The methods involve feature comparisons across teams, user groups, yearly data and competitor apps.
Solutions: Survey Design | Large-scale Data Analysis| User Segments Analysis | Competitor Comparison
View Details
Drivers’ Experience with Advanced Driver-Assistant System
My Role: UX Researcher
Timeline: 3 month
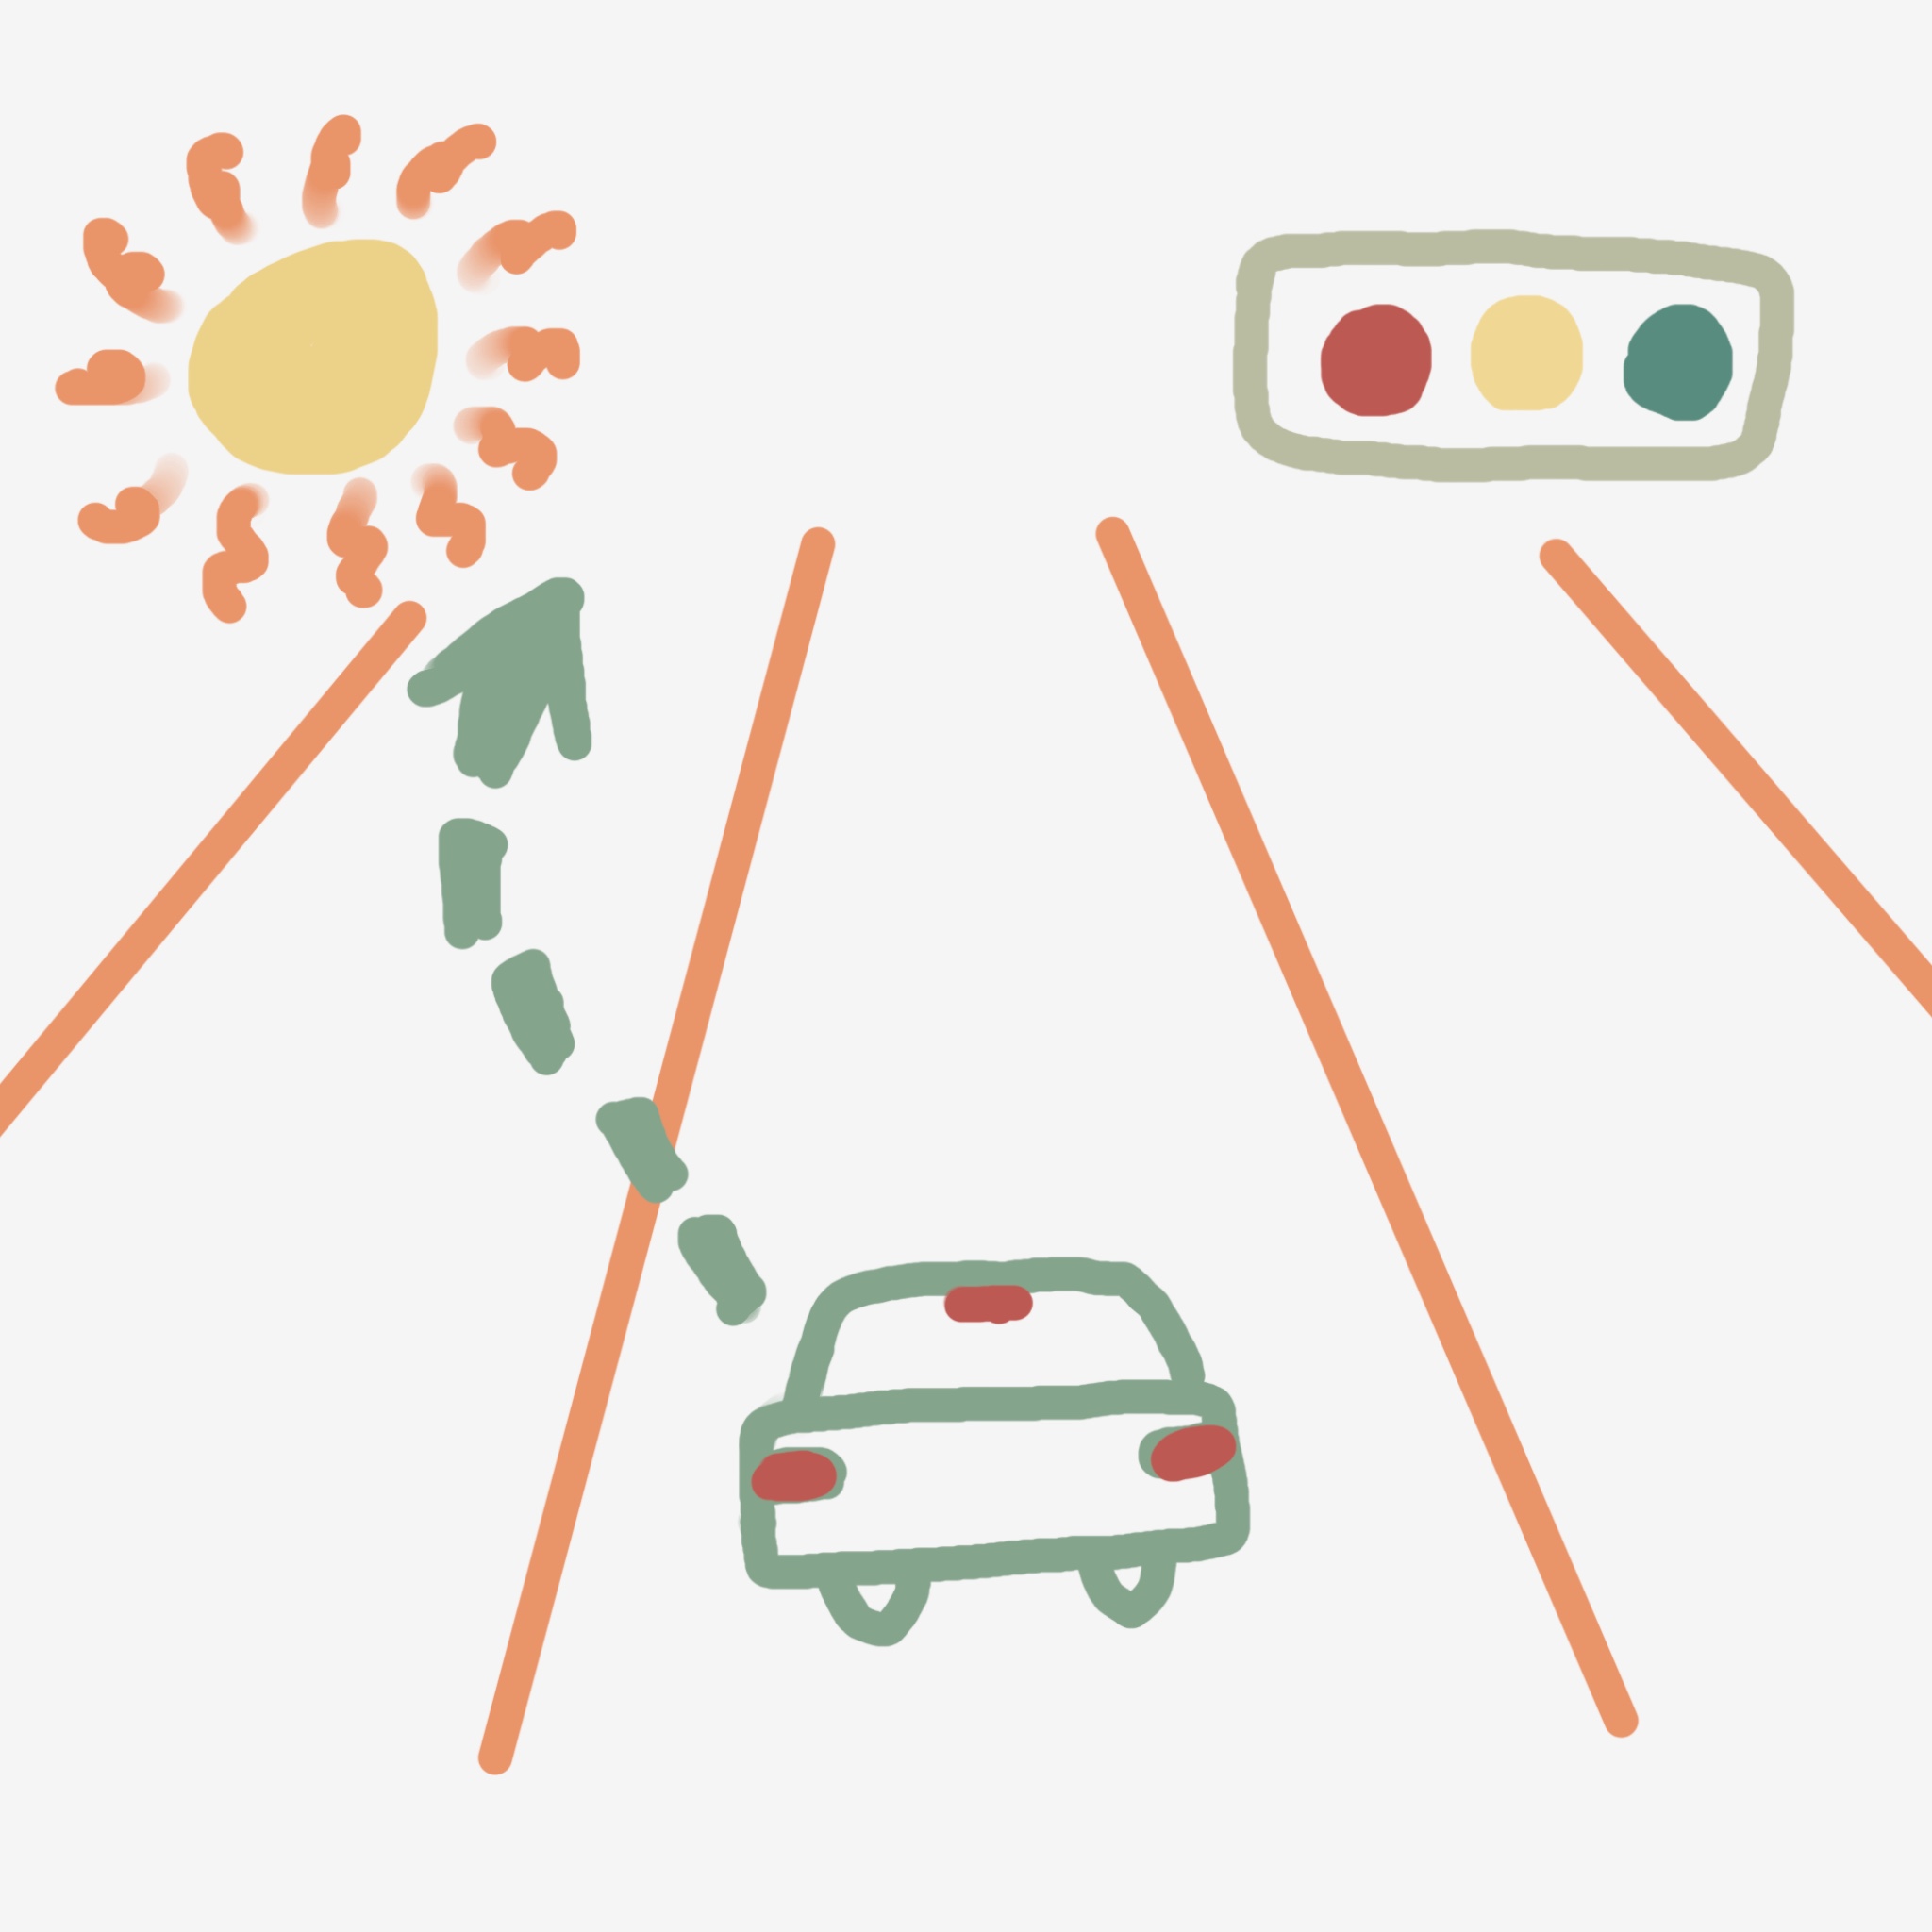
The main goal of the larger project is designing intuitive interface panels for Advanced Driver Assistance Systems (ADAS) for SAIC Motor (stakeholder) and providing insights towards ADAS industry regulation in China. I led an qualitative project to explore drivers’ experience with ADAS on the competitor models such as Tesla Model S, Volvo XC60, or Geely Borui.
Solutions: In-depth Interview | Contextual Inquiry | Competitor Analysis | Survey
View Details
Health Decision Making on Smartphones
My Role: Principle Investigator
Timeline: 1 year
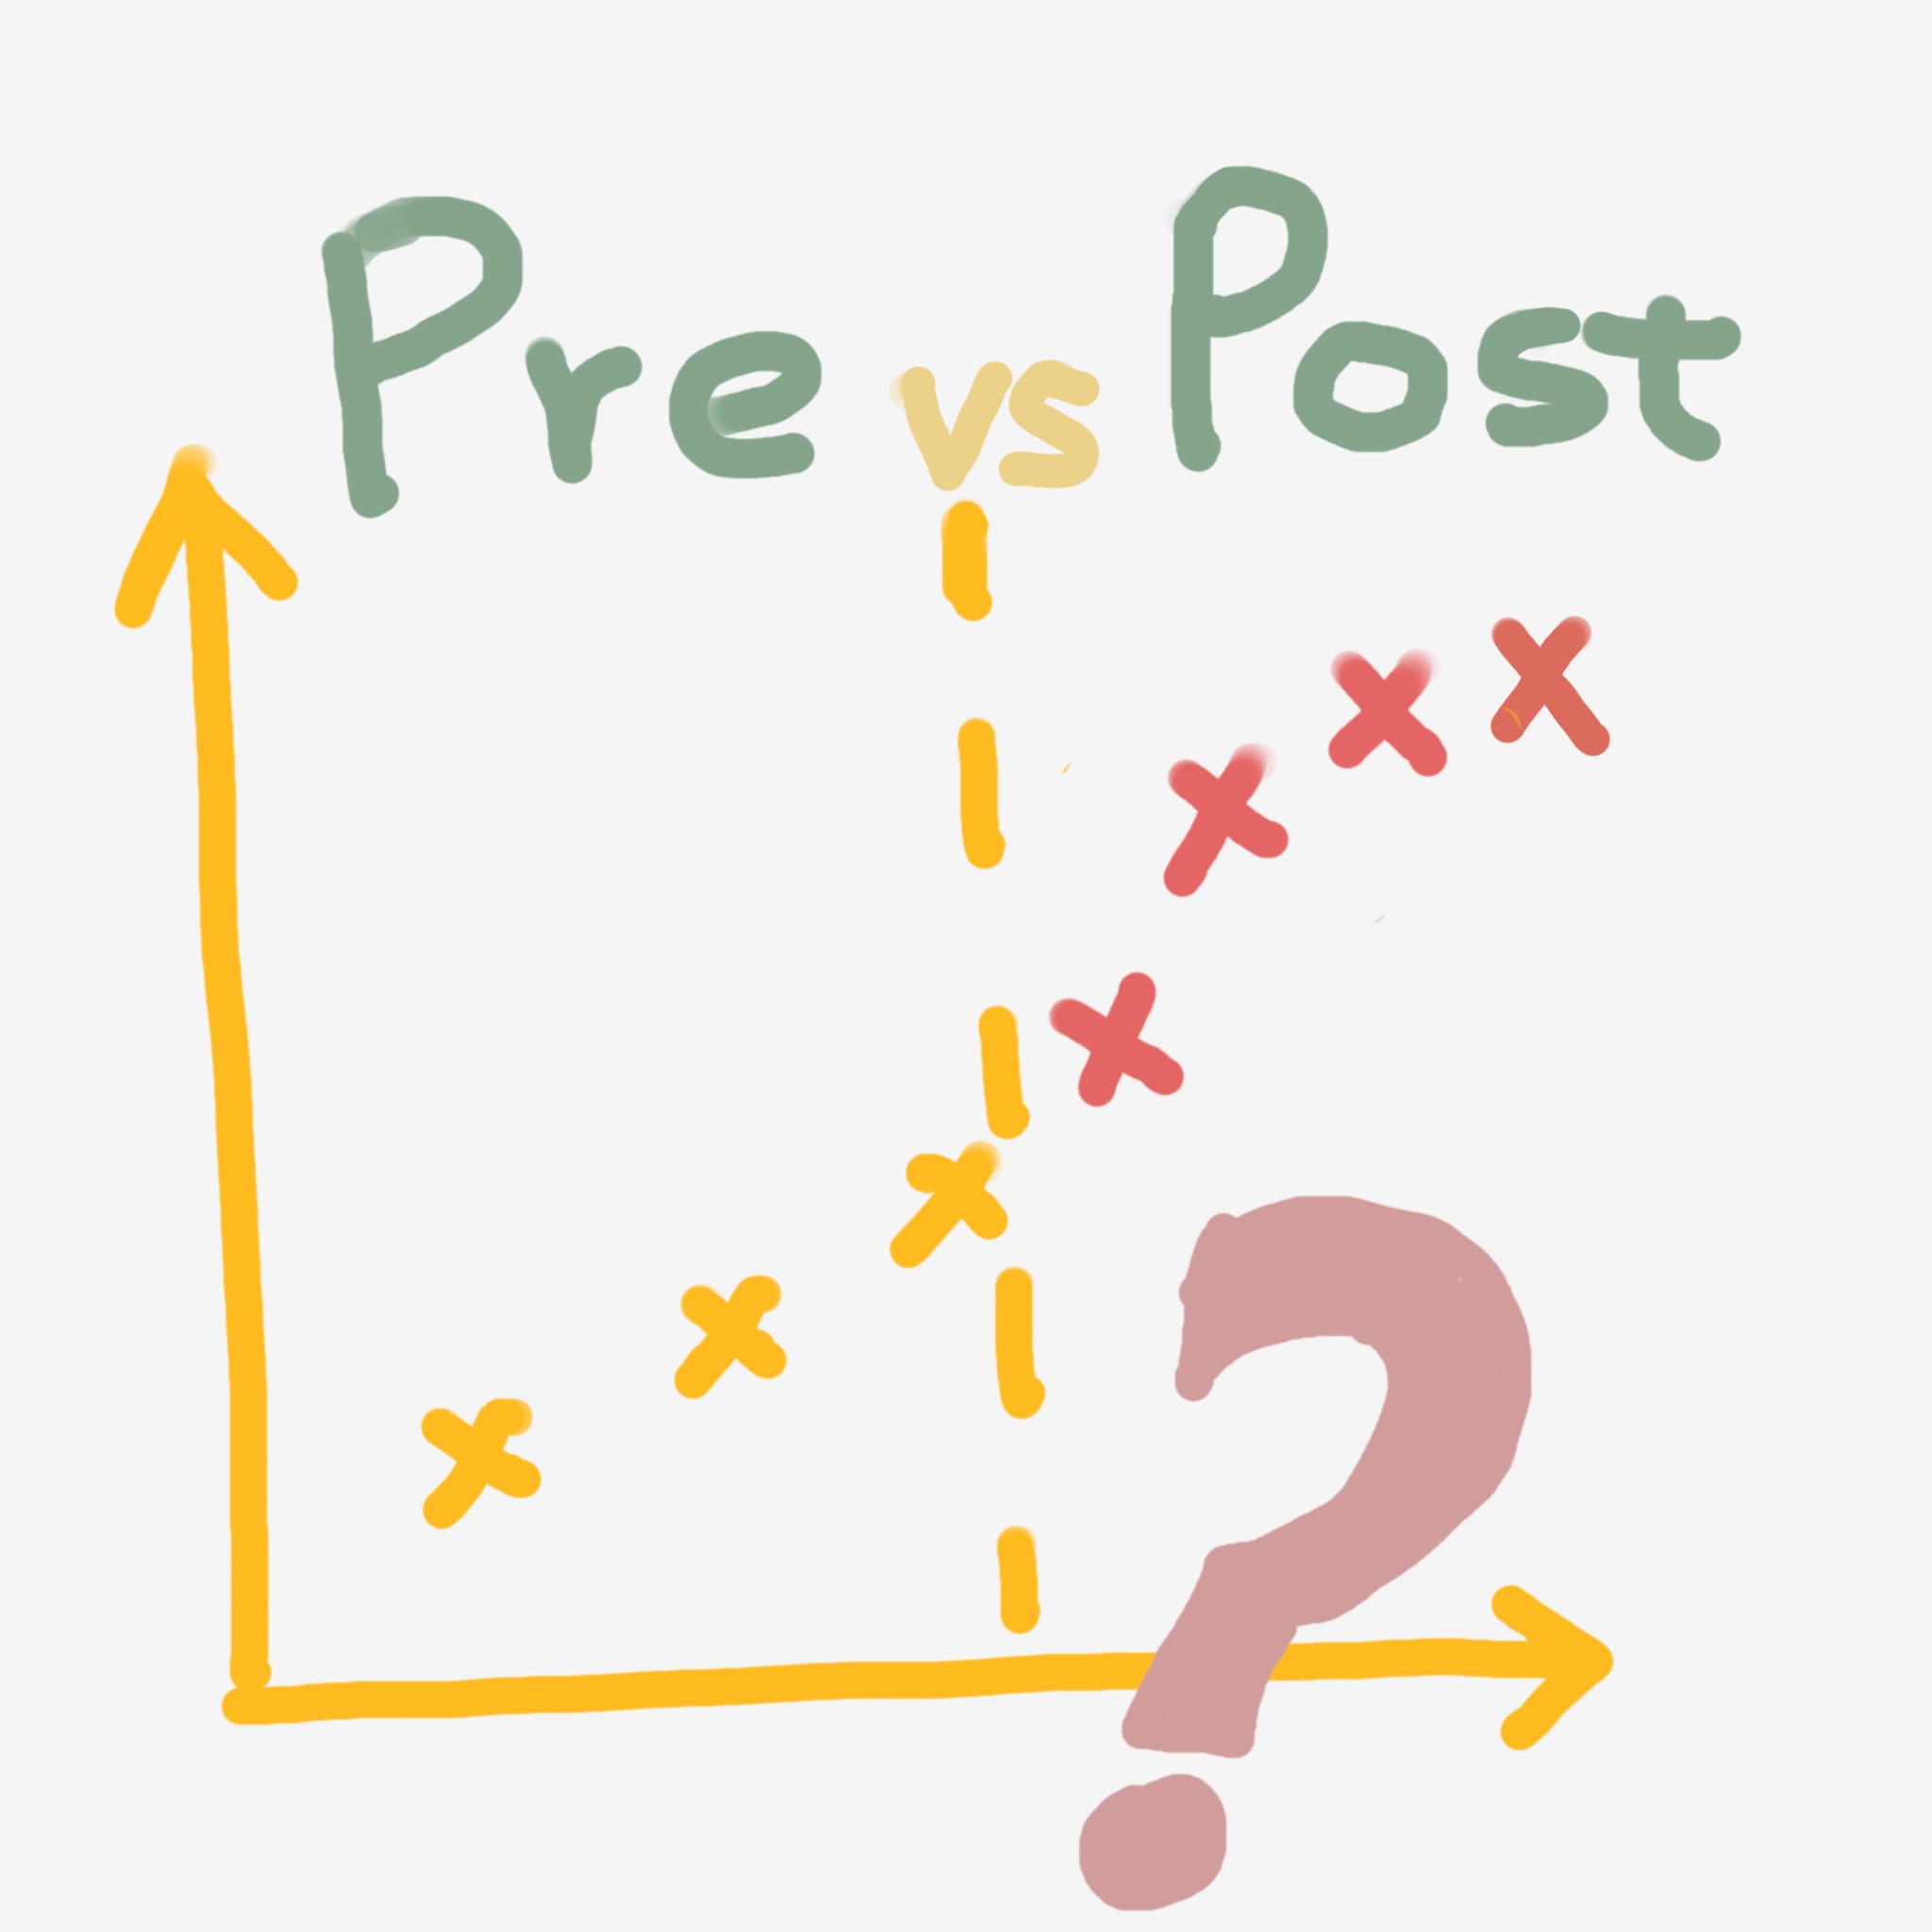
As technology (e.g. health-tracking app or apple watch) enables individuals to monitor their health data (e.g. weights, mood) through apps and wearables, the crucial question arises: How effectively can people interpret these observations for informed lifestyle decisions? This project systematically investigates human reasoning with various interrupted time series scenarios and different presentation formats (e.g. graphs vs instances; PC vs smartphone). Offered actionable design recommendations to augment data interpretation and inference-making capabilities in everyday life
Solutions: A/B testing | Large-scale Data Analysis | Cluster Analysis | Diary Study

Remote Psychology Experiment Platform
My Role: Researcher, Designer and Full-stack Developer
Timeline: 3 month
Most of my experiments are conducted outside the lab scenerio. I developed a research platform on Google Cloud, enabling remote data collection
from 2000+ participants across 5+ experiments and significantly expanding research reach during COVID-19.
To enhance user experience and increase participant retention rates, I conducted multiple A/B tests and usability tests,
effectively managing large-scale data collection with less than 1% attrition.
I also built a psychCloud template based on
Flask, Vuejs and Firestore to share with the psychology community.
Solutions: A/B testing | Usability Test | Prototype Feedback

Youtube Trending Data Dashboard
My Role: Data Analyst and Data Engineer
Timeline: 1 week
I created an interactive Shiny app to explore the Youtube Trending Data since August 2020, with 65391 records. This data dashboard enables intuitive visualization using R shiny and ggplot2. The dashboard showcases dynamic features like filters, scatterplots, bar plots, and histograms, offering a comprehensive view of the dataset's trends.
View the interactive dashboard!